R is a powerful tool for extracting and analyzing web data. It combines built-in statistical tools, advanced visualization libraries, and efficient data management packages, making it a preferred choice for data scientists and analysts. Here's what you'll learn in this guide:
- Why R for Web Scraping: R excels in handling data with tools like
rvestfor HTML scraping,RSeleniumfor JavaScript-heavy sites, and visualization libraries likeggplot2. - Setup Essentials: Install and configure R, RStudio, and key packages (
rvest,httr,tidyverse) for a seamless scraping workflow. - Scraping Basics: Learn to extract data from static and dynamic websites, handle multi-page scraping, and manage authentication challenges.
- Data Cleaning: Use
tidyverseto clean, organize, and export web-scraped data efficiently. - Data Analysis: Summarize and visualize data using tools like
ggplot2,DataExplorer, andskimr. - Advanced Tools: Explore
RSeleniumfor JavaScript-rendered content and InstantAPI.ai for automated, large-scale scraping.
Whether you're a beginner or an experienced R user, this guide provides practical steps, ethical considerations, and tools to make web scraping and analysis efficient and effective.
Automated Web Scraping in R using rvest
R Environment Setup
Getting your R environment ready is a key step for successful web scraping projects. Below, you'll find the essential tools and configurations to get started with web scraping in R.
Required R Packages
To scrape websites using R, you'll need a few important packages. Here's a quick rundown:
| Package | Purpose | Installation Command |
|---|---|---|
| rvest | Extract and parse HTML data | install.packages("rvest") |
| httr | Handle HTTP requests and authentication | install.packages("httr") |
| xml2 | Parse XML and HTML content | install.packages("xml2") |
| tidyverse | Work with and analyze data | install.packages("tidyverse") |
After installing these, load them into your script with the library() function:
library(rvest)
library(httr)
library(xml2)
library(tidyverse)
Once these packages are installed and loaded, you're ready to set up your development environment.
Development Environment Setup
A good development environment makes your work more efficient. RStudio is the go-to IDE for R programming. Here's how to install it:
For macOS Users:
# Install R and RStudio via Homebrew
brew install r
brew install --cask rstudio
For Windows Users:
# Install R and RStudio via Chocolatey
choco install r.project
choco install r.studio
R Basics for Beginners
If you're new to R, mastering some basic concepts will make web scraping much easier. Focus on these areas:
Data Types and Structures:
- Vectors
- Data frames
- Lists
- Strings
Core Operations:
- Assign variables with
<- - Call functions and use parameters
- Perform basic data manipulation
- Use control flow statements like
if,for, andwhile
Helpful Tips:
- Write clear comments to explain your code.
- Stick to consistent naming conventions.
- Break down complex tasks into smaller, manageable functions.
- Test your scripts on small datasets before scaling up.
These steps will ensure you're well-prepared to dive into web scraping with R.
Basic Web Scraping with R
HTML and CSS Basics
To get started with web scraping, it's important to understand HTML and CSS. HTML structures web pages with elements like headings (<h1>), paragraphs (<p>), and tables (<table>). CSS selectors allow you to pinpoint these elements when extracting data.
Here's a quick reference for common HTML elements and their selectors:
| Element Type | Common Use in Scraping | Example Selector |
|---|---|---|
| Tables | Product details, financial records | table.price-data |
| Divs | Grouping content | div.article-content |
| Links | URLs, navigation | a.product-link |
| Headers | Titles, categories | h2.section-title |
With this foundation, you’re ready to extract structured data using the rvest package.
Data Extraction with rvest
The rvest package in R makes web scraping straightforward. Here’s an example of scraping data from a webpage:
library(rvest)

# Read webpage
url <- "https://example.com/data"
page <- read_html(url)

# Extract specific elements
data <- page %>%
  html_nodes(".price-table") %>%
  html_table()
"Rvest's html_table() function simplifies scraping HTML tables."
Key tips: Inspect the page source to find the right selectors, handle missing values, follow website rules, and include delays to avoid overloading servers.
For data spread across multiple pages, you can expand on this method using loops or functions.
Multi-page Data Collection
To gather data from several pages, you can automate the process with a multi-page scraping approach. Here's how to do it:
library(purrr)

# Define URL pattern
base_url <- "https://example.com/page/%d"

# Function to scrape a single page
scrape_page <- function(page_num) {
  url <- sprintf(base_url, page_num)
  page <- read_html(url)
  Sys.sleep(2) # Add delay to respect rate limits

  # Extract data
  data <- page %>%
    html_nodes(".content") %>%
    html_text()
  return(data)
}

# Scrape data from multiple pages
pages <- 1:10
all_data <- map_dfr(pages, scrape_page)
Using this method, you can efficiently scrape data from dozens of pages. For example, this approach successfully handled over 50 pages in one case study.
Advanced R Web Scraping
Scraping modern websites often demands more sophisticated techniques to handle dynamic content and authentication challenges.
Extracting JavaScript-Rendered Content
Websites that rely on JavaScript to load content require tools like RSelenium, which mimics user actions in a browser.
Here's a basic example of using RSelenium to scrape content from a JavaScript-heavy site:
library(RSelenium)
library(rvest)

# Start a browser session
rD <- rsDriver(browser = "firefox",
               chromever = NULL)
remDr <- rD$client

# Navigate to the website and wait for content to load
remDr$navigate("https://www.worldometers.info/coronavirus/")
Sys.sleep(3)  # Pause to allow JavaScript execution

# Extract data using XPath
total_cases <- remDr$findElement(
    using = "xpath",
    value = '//*[@id="maincounter-wrap"]/div/span'
)$getElementText()[]
This approach ensures you can access data that isn't immediately available in the page's HTML source.
Managing Logins and Cookies
Some websites require user authentication. Depending on the complexity of the site, different methods work best:
| Method | Best For | Considerations |
|---|---|---|
| Cookie Headers | Simple logins | Requires frequent updates |
| Session Management | Complex logins | Offers better long-term stability |
| API Tokens | Modern platforms | Most reliable and secure option |
To avoid IP bans, rotate User-Agent headers and consider using proxies. Tools like ScraperAPI are helpful for bypassing CAPTCHAs and handling location-specific restrictions.
Tips for Efficient and Ethical Scraping
To scrape responsibly and handle potential issues, follow these practices:
-
Rate Limiting: Avoid overwhelming servers by adding delays between requests.
# Example function with random delays scrape_with_delay <- function(urls) { lapply(urls, function(url) { Sys.sleep(runif(1, 2, 4)) # Random delay between 2-4 seconds read_html(url) }) } -
Parallel Processing: For larger projects, use tools like Rcrawler to speed up scraping by processing multiple pages simultaneously.
library(Rcrawler) Rcrawler(Website = "example.com", no_cores = 4, MaxDepth = 2) -
Error Handling: Always account for potential issues like network errors or server blocks.
tryCatch({
    # Your scraping code here
}, error = function(e) {
    message(sprintf("Error: %s", e))
    Sys.sleep(60)  # Pause before retrying
})
For large-scale projects, Rcrawler is a powerful tool that can automatically navigate and extract data from entire websites. These strategies will help you scrape efficiently while minimizing disruptions.
sbb-itb-f2fbbd7
Data Cleaning in R
Getting web data ready for analysis often requires cleaning and organizing it. The tidyverse ecosystem offers powerful tools to transform messy web data into structured datasets.
Data Organization with tidyverse
The dplyr package helps clean and format scraped data efficiently. Here's an example:
library(tidyverse)

# Clean and organize scraped product data
cleaned_data <- raw_data %>%
  select(product_name, price, rating) %>%  # Choose relevant columns
  mutate(
    price = as.numeric(gsub("[$,]", "", price)),  # Remove non-numeric symbols from price
    rating = as.numeric(str_extract(rating, "\\d+\\.?\\d*"))  # Extract numeric ratings
  ) %>%
  filter(!is.na(price) & !is.na(rating))  # Exclude rows with missing values
For nested data, use tidyr to simplify and flatten it:
# Flatten nested JSON data
flattened_data <- nested_json %>%
  unnest_wider(reviews) %>%
  unnest_longer(comments) %>%
  separate_wider_delim(
    date_time,
    delim = " ",
    names = c("date", "time")
  )
After organizing the data, tackle common problems that might compromise its quality.
Fixing Data Problems
Here are some common data issues and how to address them:
| Issue | Solution | Function |
|---|---|---|
| Missing Values | Impute or replace | replace_na() |
| Inconsistent Text | Standardize format | str_trim(), tolower() |
| Duplicate Entries | Remove duplicates | distinct() |
| Invalid Dates | Parse correctly | as.Date() |
For instance, you can handle missing numeric values using the mice package:
library(mice)

# Impute missing numeric values
imputed_data <- raw_data %>%
  mice(m = 5, method = "pmm") %>%
  complete()
Once your data is clean and consistent, it's time to save it in a format ready for analysis.
Data Export Options
Export your cleaned data using various formats:
# Save as a CSV file
write_csv(cleaned_data, "cleaned_website_data.csv")

# Export as a JSON file
jsonlite::write_json(
  cleaned_data,
  "cleaned_data.json",
  pretty = TRUE
)

# Save as an RDS file
saveRDS(cleaned_data, "cleaned_data.rds", compress = "xz")

# Export to a database
library(DBI)
dbWriteTable(
  con,
  "cleaned_web_data",
  cleaned_data
)
To ensure reproducibility, document your cleaning steps in R Markdown. A well-documented and organized dataset is essential for accurate analysis in R.
Data Analysis in R
Clean data is the gateway to R's powerful analysis and visualization capabilities. Here's how you can summarize and visualize your data effectively, building on earlier steps of data extraction and cleaning.
Data Overview Methods
The skimr package is a great tool for generating a detailed summary with minimal effort:
library(skimr)
library(tidyverse)

# Generate a detailed summary
skim(cleaned_web_data)

# Calculate specific metrics
web_stats <- cleaned_web_data %>%
  summarise(
    avg_price = mean(price, na.rm = TRUE),
    median_rating = median(rating, na.rm = TRUE),
    total_products = n(),
    missing_values = sum(is.na(price))
  )
For a more statistical breakdown, the psych package's describe() function provides metrics like mean, standard deviation, skewness, and kurtosis:
library(psych)

# Generate detailed statistics
describe(cleaned_web_data) %>%
  select(n, mean, sd, median, min, max, skew, kurtosis)
These summaries lay the groundwork for deeper analysis and visual exploration using ggplot2.
Charts and Graphs with ggplot2
ggplot2 is a versatile tool for creating visualizations that highlight key patterns in your data:
# Analyze price distribution
ggplot(cleaned_web_data, aes(x = price)) +
  geom_histogram(binwidth = 10, fill = "steelblue") +
  labs(
    title = "Product Price Distribution",
    x = "Price ($)",
    y = "Count"
  ) +
  theme_minimal()

# Examine rating trends over time
ggplot(cleaned_web_data, aes(x = date, y = rating)) +
  geom_line() +
  geom_smooth(method = "loess") +
  labs(
    title = "Product Ratings Trend",
    x = "Date",
    y = "Average Rating"
  )
Example: Web Data Analysis
Here's an example workflow combining various tools for analyzing web data:
# Load required packages
library(tidyverse)
library(DataExplorer)
library(corrplot)

# Visualize relationships between variables
plot_correlation(
  cleaned_web_data,
  maxcat = 5,
  title = "Variable Correlations"
)

# Summarize and visualize categories
cleaned_web_data %>%
  group_by(category) %>%
  summarise(
    avg_price = mean(price),
    avg_rating = mean(rating),
    count = n()
  ) %>%
  arrange(desc(count)) %>%
  head(10) %>%
  ggplot(aes(x = reorder(category, count), y = count)) +
  geom_bar(stat = "identity", fill = "darkblue") +
  coord_flip() +
  labs(
    title = "Top 10 Product Categories",
    x = "Category",
    y = "Number of Products"
  )
The DataExplorer package is especially useful for identifying data quality issues. For example, it can reveal that only 0.3% of web-scraped rows are fully complete, while around 5.7% of observations have missing values. This helps you focus your cleaning efforts where they matter most.
Popular R Packages for Data Analysis
Here’s a quick comparison of some widely used R packages for data analysis:
| Package | Best Used For | Key Features |
|---|---|---|
| skimr | Quick summaries | Compact summary stats and visualizations |
| DataExplorer | Automated EDA | Full reports and data quality checks |
| corrplot | Correlation analysis | Visual correlation matrices |
| GGally | Variable relationships | Enhances ggplot2 with specialized tools |
| summarytools | Detailed summaries | Ready-to-publish statistical tables |
Using InstantAPI.ai
R scripts are powerful, but sometimes you need a faster, more automated solution. That’s where InstantAPI.ai comes in. This AI-driven tool simplifies the process of turning websites into structured data, saving you time and effort.
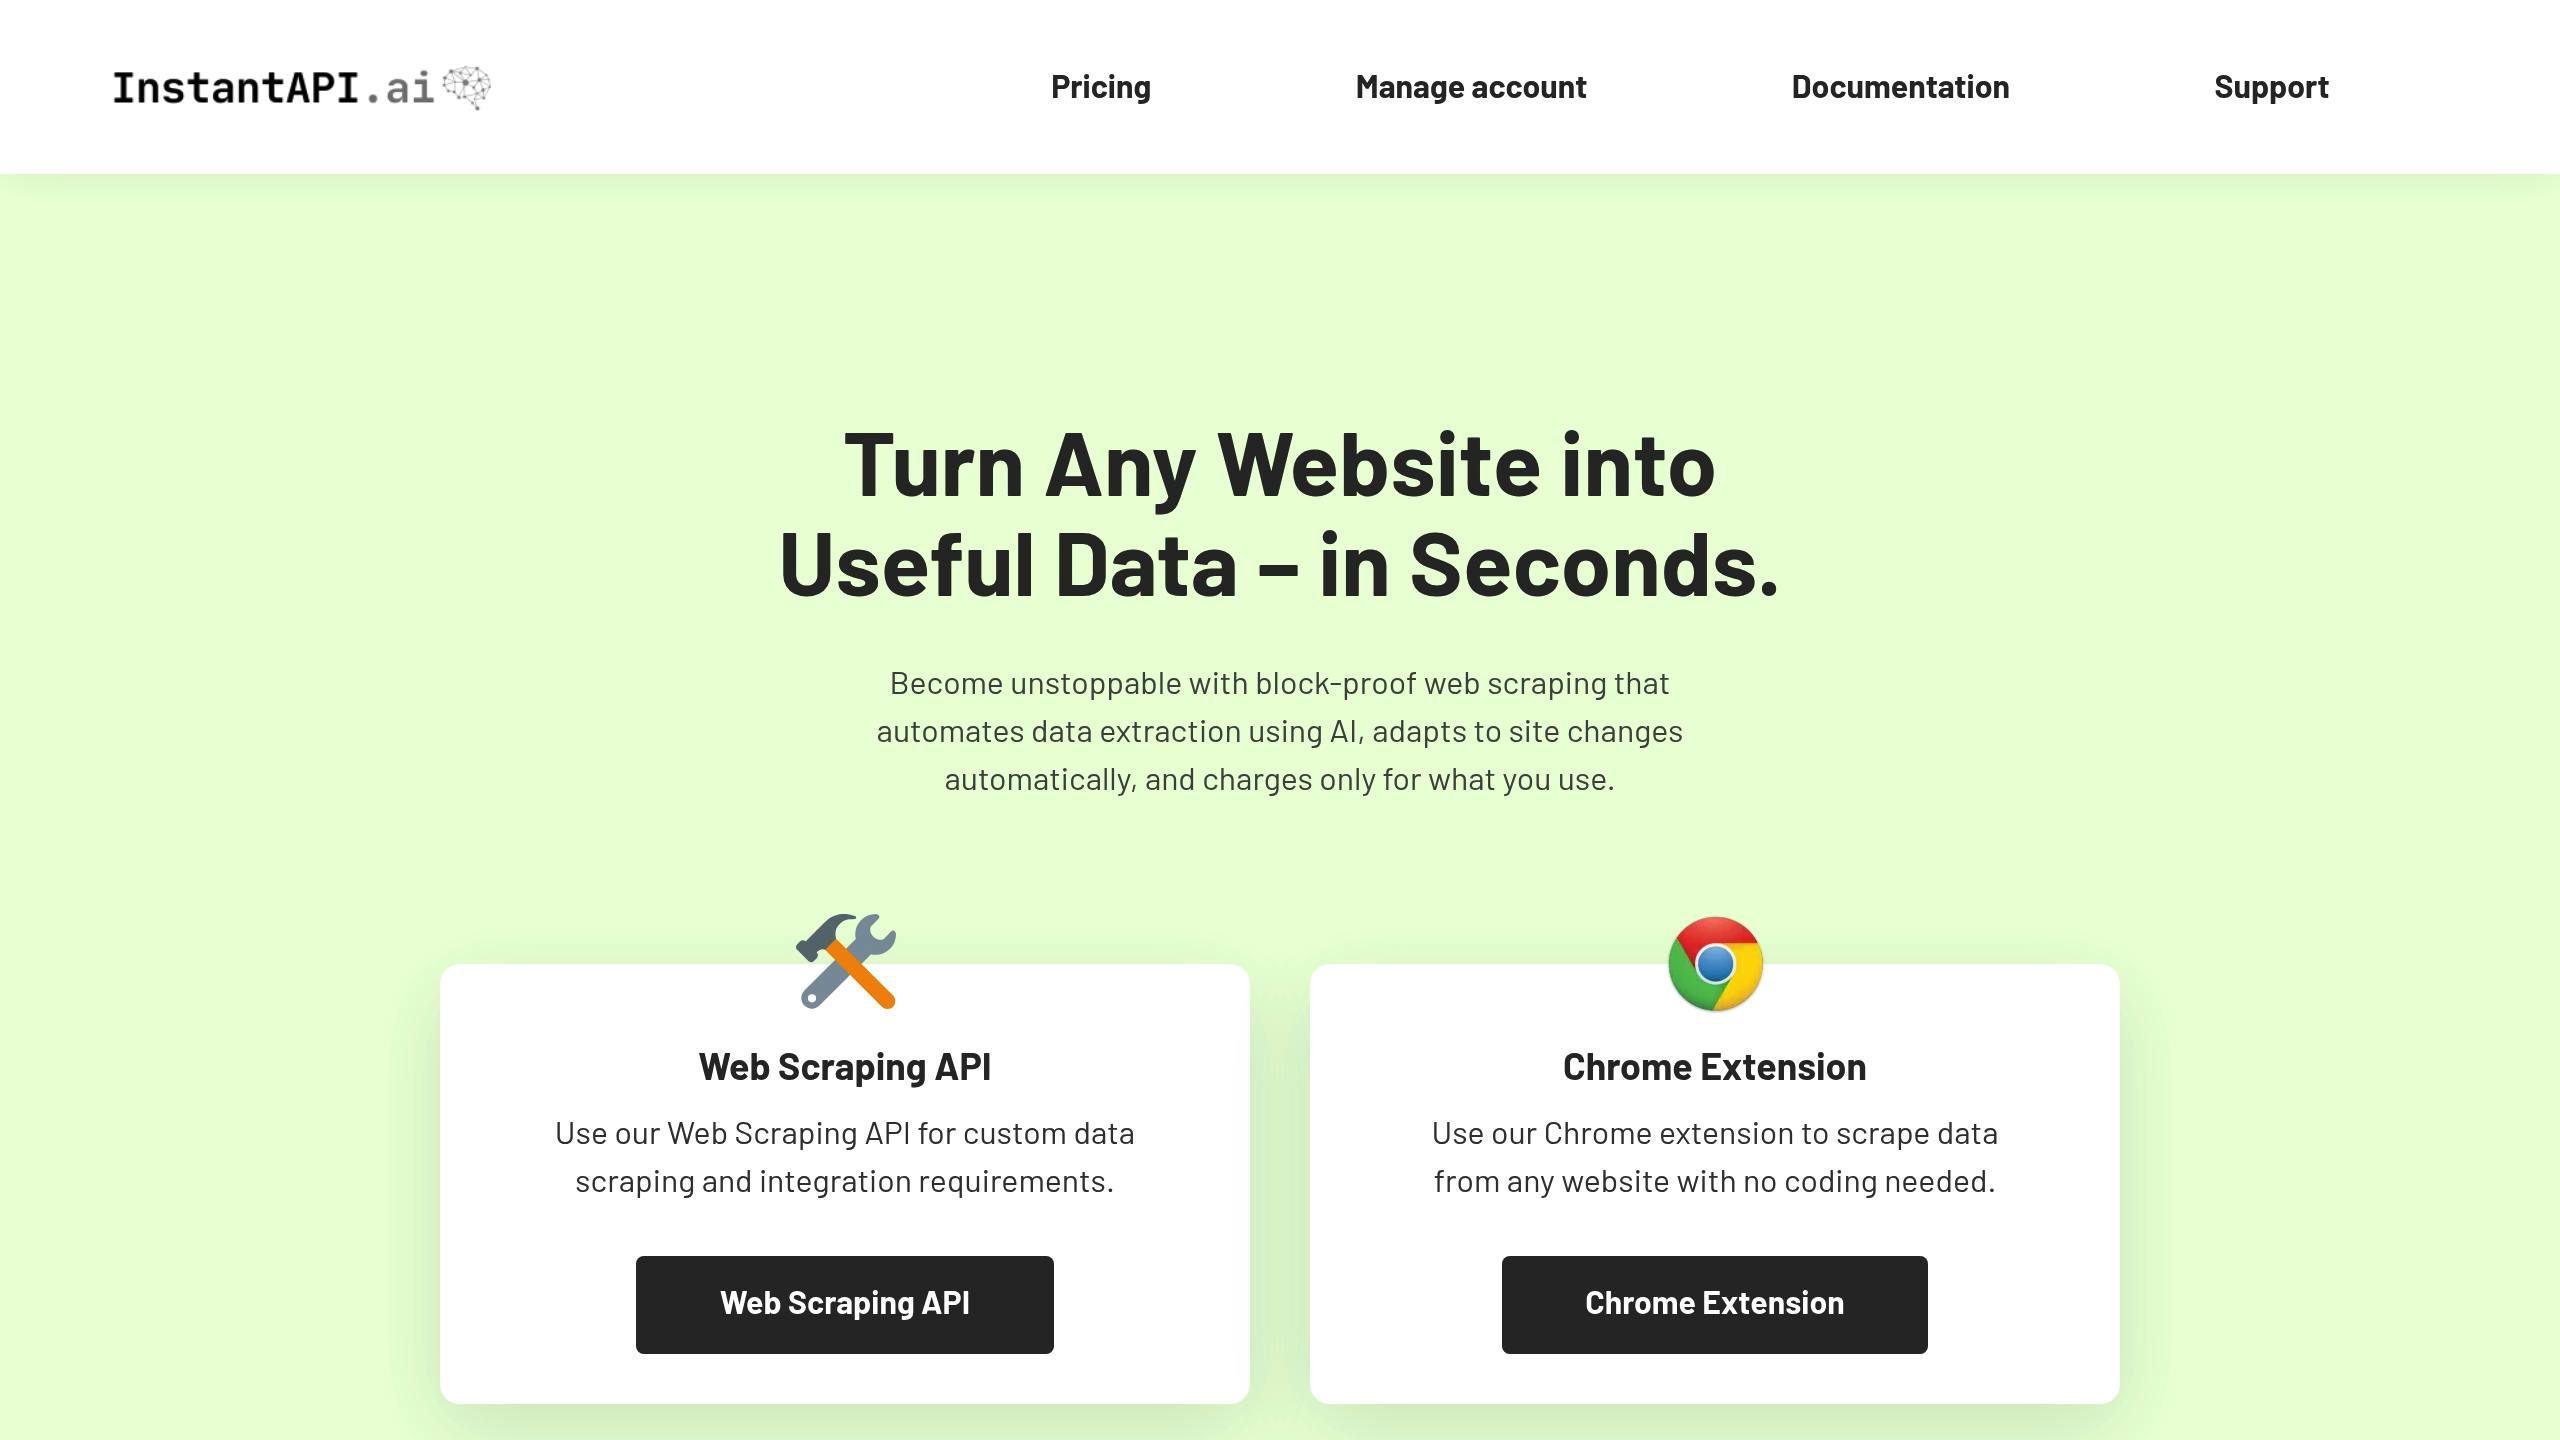
What Is InstantAPI.ai?
InstantAPI.ai is a web scraping platform that uses artificial intelligence to extract data from websites and deliver it through an API. It tackles common challenges like:
- Handling JavaScript-heavy websites
- Bypassing CAPTCHAs
- Managing proxies across 195+ countries
- Transforming data into usable formats in real time
The platform operates with a headless Chromium browser, achieving an impressive 99.99% success rate. This means less time troubleshooting and more time focusing on data analysis.
# Example: Using InstantAPI.ai with R
library(httr)
library(jsonlite)

# API call to InstantAPI.ai
response <- GET(
  url = "https://api.instantapi.ai/v1/extract",
  add_headers(
    "Authorization" = "Bearer YOUR_API_KEY",
    "Content-Type" = "application/json"
  ),
  body = list(
    url = "https://example.com",
    schema = list(
      title = "text",
      price = "number",
      description = "text"
    )
  ),
  encode = "json"
)

# Convert response to R dataframe
data <- fromJSON(rawToChar(response$content))
Don’t forget to replace YOUR_API_KEY with your actual key.
Comparing InstantAPI.ai and R Scripts
Here’s a quick breakdown of how InstantAPI.ai stacks up against traditional R scripts:
| Feature | InstantAPI.ai | R Scripts |
|---|---|---|
| Setup Time | Minutes | Hours/Days |
| Maintenance | Automatic updates | Manual upkeep |
| Anti-bot Handling | Built-in | Custom coding |
| Learning Curve | Easy to use | Requires expertise |
| Cost Structure | Pay-as-you-go ($10 per 1,000 pages) | Free but time-heavy |
| Customization | AI-driven | Full control |
InstantAPI.ai integrates smoothly with R, offering a quick and efficient way to scrape data, especially for complex or dynamic websites.
When to Use InstantAPI.ai
InstantAPI.ai is ideal for situations where you need:
- Fast deployment with minimal coding
- Support for JavaScript-heavy or dynamic content
- Automatic adjustments to website changes
- Large-scale data collection across multiple regions
"After trying other options, we were won over by the simplicity of InstantAPI.ai's Web Scraping API. It's fast, easy, and allows us to focus on what matters most - our core features." - Juan, Scalista GmbH
For R users, InstantAPI.ai is a great complement to your existing tools, especially for challenging sites or when speed is essential. Plus, the free tier (500 pages per month) lets you test it out or handle smaller projects before upgrading to a paid plan. Combining InstantAPI.ai's scraping power with R's analysis tools creates an efficient and seamless workflow.
Conclusion
Key Takeaways
R offers a powerful set of tools for web scraping and data analysis, making it a go-to choice for many data professionals.
Here's what we covered:
- Basics of HTML and CSS for web scraping
- Handling JavaScript-heavy content and authentication challenges
- Cleaning data effectively with tidyverse tools
- Creating visualizations using ggplot2
- Using InstantAPI.ai for tackling complex scraping tasks
If you're looking to build on these skills, there are plenty of resources to help you dive deeper.
Recommended Resources
Boost your R web scraping expertise with these helpful materials:
Official Documentation
- R Documentation
- rvest Package Guide
- tidyverse Learning Resources
These guides provide detailed instructions and examples to enhance your understanding.
Community Support
- Stack Overflow's R Tag
- R-bloggers
- RStudio Community Forums
"For smaller projects with limited budgets, do-it-yourself tools can be adequate, especially if technical expertise is available. But in the case of large-scale, ongoing, or complex data extraction tasks, managed webscraping services are smarter by far." - Juveria Dalvi
You can also connect with local R user groups or join online communities. The R community is known for being welcoming and eager to help newcomers master these essential data science techniques.